
SMARTS
Nasdaq SMARTS Surveillance technology powers surveillance and compliance for 40 marketplaces, 11 regulators and 100 market participants across 65 markets globally. However, the software still looked and worked exactly like it did 20 years ago when it was first released. The team then set out to find out the new way compliance officers did their jobs today. As a result, we created an entirely new way to track, analyze and handle a compliance alert from beginning to end.
Role: Creative Direction

Dashboard
The new dashboard allows the user to quickly identify the latest alerts by type and being to triage the high priority items in relation to the volume of alerts coming in. The stretch chord chart give the user a more visual way to understand the connections between portfolio managers and traders as they begin to explore the reason for the alert trigger.

Spread Graph
The spread graph view is the most important view when investigating an alert. When designing this view, we wanted to give this the largest real estate possible while keeping relevant information on the alert and the trade close to the chart. This chart is know as the "Christmas chart" and even after multiple iteration with different colors and chart styles the we decided to keep the original one because well... it works.
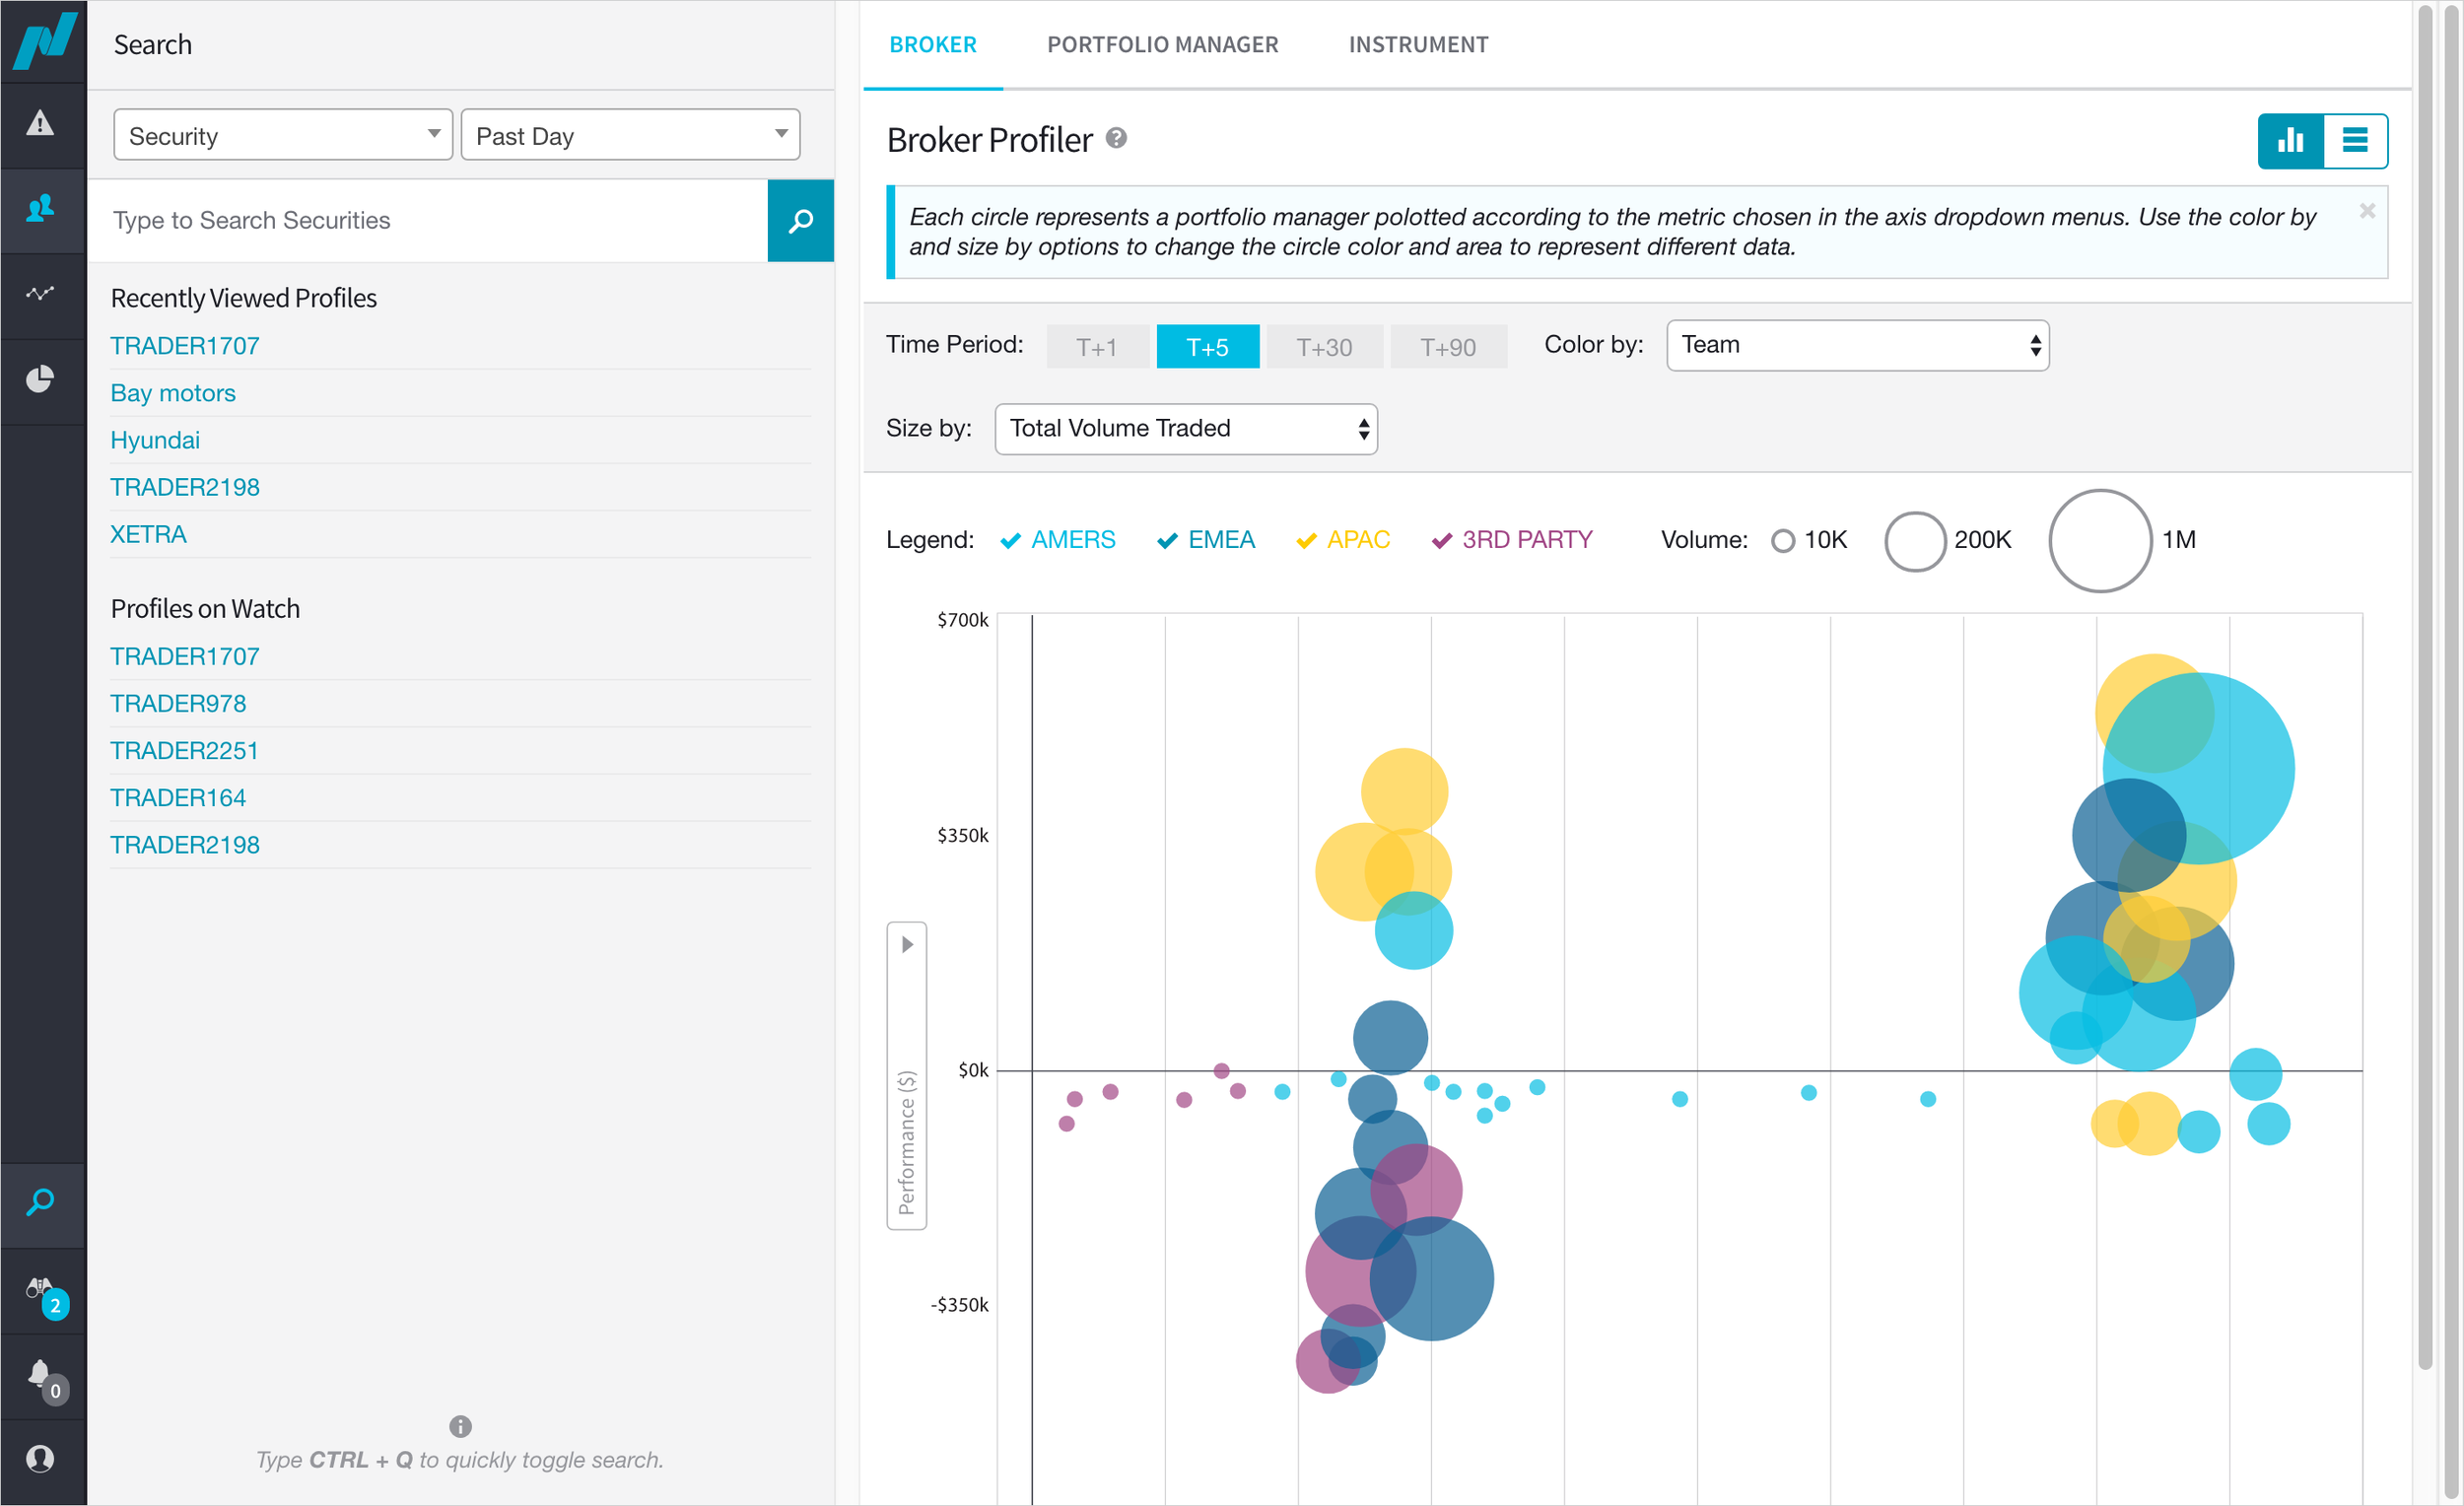
Broker Profile
The original product didn't really gave the officer much past information on a broker, we through that maybe giving an analytical background on the traders triggering the alerts would help the internal teams flag potentials future risks. It was really important to not give the impression of a negative outcome since the alerts don't always become a big risk, therefore we removed red and green form the chart.